We have previously examined the cortical processing in response to somatosensory, auditory and noxious stimuli, using magnetoencephalography in humans. Here, we performed a similar analysis of the processing in the human visual cortex for comparative purposes. Following flash stimuli applied to the right eye, activations were found in eight cortical areas: the left medial occipital area around the calcarine fissure (primary visual cortex, V1), the left dorsomedial area around the parietooccipital sulcus (DM), the ventral (MOv) and dorsal (MOd) parts of the middle occipital area of bilateral hemispheres, the left temporo-occipito-parietal cortex corresponding to human MT/V5 (hMT) and the ventral surface of the medial occipital area (VO) of the bilateral hemispheres. The mean onset latencies of each cortical activity were 27.5 (V1), 31.8 (DM), 32.8 (left MOv), 32.2 (right MOv), 33.4 (left MOd), 32.3 (right MOv), 37.8 (hMT), 46.9 (left VO) and 46.4 (right VO) ms. Therefore, the cortico-cortical connection time of visual processing at the early stage was 4-6 ms, which is very similar to the time delay between sequential activations in somatosensory and auditory processing. In addition, the activities in V1, MOd, DM and hMT showed a similar biphasic waveform with a reversal of polarity after 10 ms, which is a common activation profile of the cortical activity for somatosensory, auditory and pain-evoked responses. These results suggest similar mechanisms of the serial cortico-cortical processing of sensory information among all sensory areas of
Inui K, Kakigi R. Temporal analysis of the flow from V1 to the extrastriate cortex in humans. J Neurophysiol 96: 775-784, 2006.
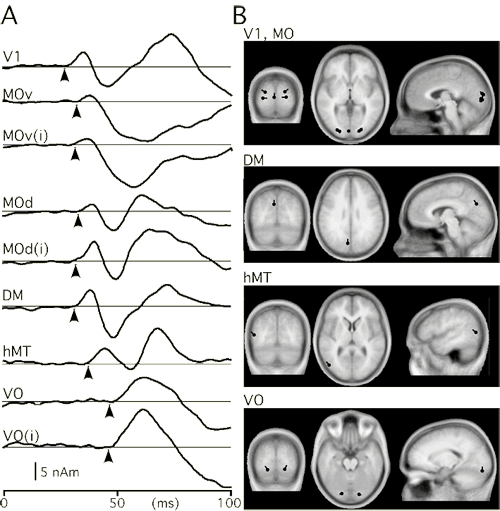
Grand average of the time course of each source's strength for all subjects. A, the grand-averaged waveforms. Arrowheads indicate the mean onset latency. B, the mean location and orientation of each source overlaid on standard brain images.


