We recorded the activities of neurons in the posterior inferior temporal cortex (PIT) of three hemispheres of three monkeys performing a visual fixation task. We characterized the color and shape selectivities of each neuron, mapped its receptive field (RF), and studied the distributions of these response properties within PIT. Using a set of color stimuli that were systematically distributed in CIE-xy chromaticity diagram, we found numerous color-selective neurons distributed throughout the area examined. Neurons in the ventral region of PIT tended to have sharper color tuning than those in the dorsal region. We also found a crude retinotopic organization in the ventral region. Within the ventral region of PIT, neurons in the dorsal part had RFs that overlapped the foveal center; the eccentricity of RFs increased in the more ventral part, and neurons in the anterior and posterior parts had RFs that represented the lower and upper visual fields, respectively. In all three hemispheres, the region where sharply tuned color-selective neurons were concentrated was confined within this retinotopic map. These findings suggest that PIT is a heterogeneous area and that there is a circumscribed region within it that has crude retinotopic organization and is involved in the processing of color.
Yasuda M, Banno T and Komatsu H
Color Selectivity of Neurons in the Posterior Inferior Temporal Cortex of the Macaque Monkey.
Cerebral Cortex, doi: 10.1093/cercor/bhp227, 2009
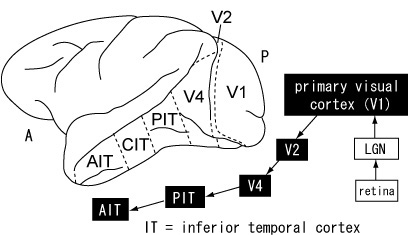
Visual pathway involved in color information processing. Color signal is transmitted along the ventral visual pathway in the cerebral cortex including areas V1, V2, V4 and finally reaches to the inferior temporal (IT) cortex.
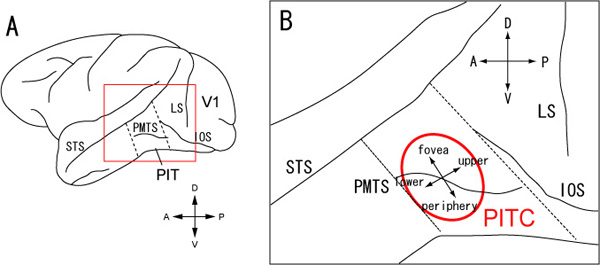
A: Region in the posterior inferior temporal (PIT) cortex where we have examined in the present study. PIT is located between the two dashed lines.
B: Enlarged view of the brain region around PIT. A red oval indicates the position of the new color-related area identified in the present study (PITC). PITC has a crude retinotopic map.
* Click to see the enlarged figure.
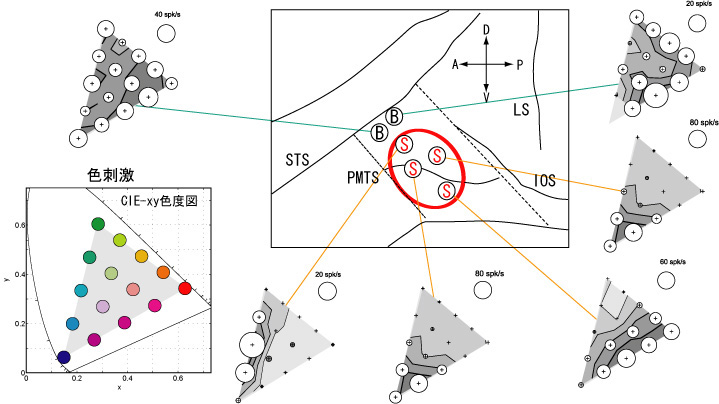
Color selectivity of neurons recorded in and around PITC. S and B represents neurons that exhibited sharp (S) or broad (B) color selectivity. Color stimuli used to test color selectivity is shown to the left-bottom that were defined on the CIE-xy chromaticity diagram. Color selectivity of 6 neurons are shown as bubble plots in which response to each color is indicated as the diameter of the circle and plotted at the corresponding position of the chromaticity diagram.
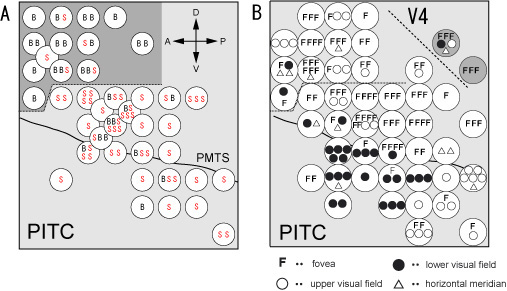
Results of the mapping of the color selectivity and receptive fields from the PIT of one monkey.


